Is Solar Worth It in San Diego? Prices & Savings Strategies for 2026

San Diegans face some of the highest residential electricity rates in the United States, with average baseline costs lingering near $0.46 to $0.47 per kWh (for reference, the national average is around $0.20 per kWh). With high electricity prices and abundant sunshine, San Diego has historically been one of the most financially compelling places to go solar.
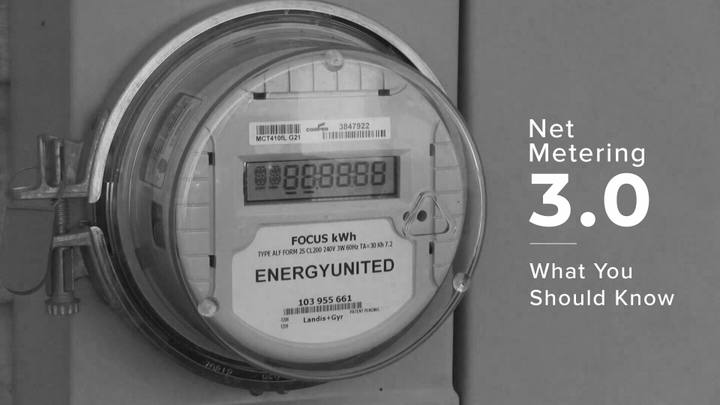
However, with California’s Net Billing Tariff (NEM 3.0) in place for SDG&E, the economic formula has shifted: solar alone is no longer the target strategy, solar paired with battery storage is.
This guide breaks down the typical solar costs in San Diego, how NEM 3.0 impacts your bill, and what you need to know to maximize your savings potential.
San Diego Solar & Battery Economics: 2026 Numbers at a Glance
Because SDG&E’s electricity rates are so high, offsetting your grid usage can deliver a substantial return on investment, especially if you focus on using as much of your solar power as possible (known as “self-consumption”) rather than selling excess power back to the grid.
Here’s a quick look at what to expect for a typical home in San Diego:
-
Average 3-Bedroom Household Usage: 6,200 kWh per year
-
Target Solar Array Size: 4.2 kW DC
-
Target Battery Storage Capacity: 10 kWh to 13.5 kWh (e.g., Tesla Powerwall 3 or Enphase IQ Battery)
-
Average Cost Per Watt (Solar Only): $2.95 / Watt
-
Gross Solar Array Cost: $12,390
-
Gross Battery Addition Cost: ~$9,500-$11,000
-
Total Gross System Cost (Solar + Storage): ~$22,390
-
Estimated Net Payback Period: 6.5 to 8.5 years (Faster payback than solar-only due to high SDG&E avoided costs)
Of course, every household is unique. Your system size, cost, and savings potential depend largely on how much electricity you use.
Navigating NEM 3.0 in SDG&E Territory: Why Batteries Change Everything
If you install solar in San Diego today, your system will be interconnected under California’s Net Billing Tariff (NEM 3.0). Understanding this policy is critical to getting the most value from your solar system.
1. Storing is Better Than Selling
Under old net metering rules (NEM 2.0), sending 1 kWh of solar to the grid earned you a credit equal to full retail value (~$0.35-$0.45). Under NEM 3.0, grid exports are credited based on the state’s Avoided Cost Calculator (ACC), averaging just $0.05 to $0.08 per kWh during midday solar peaks.
2. The Time-of-Use (TOU) Dilemma
SDG&E requires residential solar customers to use Time-of-Use rates (such as TOU-DR1 or EV-TOU-5). In these plans, electricity prices jump dramatically between 4:00 PM and 9:00 PM, peaking at $0.60 to $0.70+ per kWh during hot summer months.
3. The Battery Solution (“Self-Consumption”)
Without a battery, your system exports cheap energy at noon ($0.05/kWh) and forces you to buy expensive energy at 7:00 PM ($0.65/kWh).
Here’s where home battery storage adds serious value:
-
Your excess midday solar charges your battery instead of going to SDG&E for pennies on the dollar.
-
From 4:00 PM to 9:00 PM, your battery powers your home instead of the grid.
-
You avoid buying SDG&E’s most expensive peak electricity, unlocking 4x to 5x higher financial value per kilowatt-hour than sending that energy back to the grid.
Battery storage is also key to keeping the lights on during power outages. Solar systems without battery storage are shut off during power outages. This is to prevent them from backfeeding power onto the grid while utility workers are repairing it.
Ready to see your numbers?
See your real solar price in 90 seconds
Enter your address — we'll show you the system, savings, and price for your exact roof.
Climate Zones Across San Diego County
While San Diego enjoys ideal solar weather overall, inland microclimates impact your baseline electricity bill and required system sizing:
-
Coastal Belt (La Jolla, Pacific Beach, Downtown, Oceanside): The marine layer (“May Gray” and “June Gloom”) reduces solar yield slightly in late spring. However, mild coastal weather keeps household energy consumption low (~5,500 kWh/year), allowing a small 3.5 kW to 4.0 kW array paired with one battery to offset nearly 100% of grid dependence.
-
Inland Valleys (Escondido, El Cajon, Poway, Chula Vista): Shielded from ocean breezes, interior valleys experience high summer heat waves. Air conditioning drives annual usage up to 7,500-9,000+ kWh. To handle peak summer evening cooling without drawing from SDG&E, homes here typically require a 5.5 kW to 7.0 kW solar array paired with 15-20 kWh of battery storage.
San Diego Solar Incentives & Permitting Rules
-
Self-Generation Incentive Program (SGIP): California’s SGIP provides state rebates for residential battery installations. While general market funds are limited, prioritized budgets remain accessible for medically vulnerable households or low-income properties in high wildfire-threat districts.
-
California Property Tax Exclusion: Adding solar and storage increases your property value, but under state law, the added value is excluded from your annual property tax assessment (scheduled through January 1, 2027).
-
Expedited Permitting via SolarAPP+: The City of San Diego Development Services Department (DSD) utilizes the automated SolarAPP+ platform. Qualifying residential solar and storage permits are issued in 1 to 5 business days, significantly speeding up installation timelines compared to traditional manual plan checks. Interconnection approval through SDG&E typically follows within 15 to 30 business days.
Data Sourcing & Methodology
To maintain editorial accountability and satisfy search transparency standards, our calculation models rely strictly on verifiable, public data structures:
-
Baseline Electricity Usage: The 6,200 kWh annual baseline consumption figure for a standard 3-bedroom San Diego residential footprint is derived directly from the California Energy Commission (CEC) Residential Appliance Saturation Study (RASS). It evaluates CEC Building Climate Zones 7 (Coastal) and 10 (Inland San Diego) for residential electrical load profiles.
-
Solar & Storage Production Yield: Photovoltaic production estimates (calculating that a 4.2 kW DC system yields approximately 6,600 kWh AC annually in San Diego) are mapped via the National Renewable Energy Laboratory (NREL) PVWatts Calculator. The calculation uses local solar irradiance parameters (Latitude 32.71, Longitude -117.16) assuming a standard 14.08% system loss coefficient. Battery round-trip efficiency is modeled at 90% based on manufacturer standards.
-
Utility Rate & Tariff Structures: Financial payback modeling applies the SDG&E Schedule TOU-DR1 Tariff rates. Avoided cost export credits are calculated using the CPUC Net Billing Tariff Avoided Cost Calculator (ACC) model output averages ($0.05-$0.08/kWh midday baselines).
-
Solar and Battery Pricing: The baseline $2.95 per watt tracking metric is based on live pricing from Solar.com’s network of installation partners serving the Greater San Diego Metro. Solar and battery pricing varies based on the installation company, financing type, project scope, and site conditions.
Your next step
See exactly what solar costs on your roof
We use satellite data and your utility rates to show your price and payback in about 90 seconds, with no sales calls.