Solar by city
Find your city. See your math.
Solar prices, utility rules, and adoption change block by block. We publish the local numbers for 18 Southern California cities, so you know exactly what you're walking into.
18city guides
370,000+homes on solar in these cities
$2.41–$2.54current installer pricing per watt
Four cities telling four different stories
Same engine, different math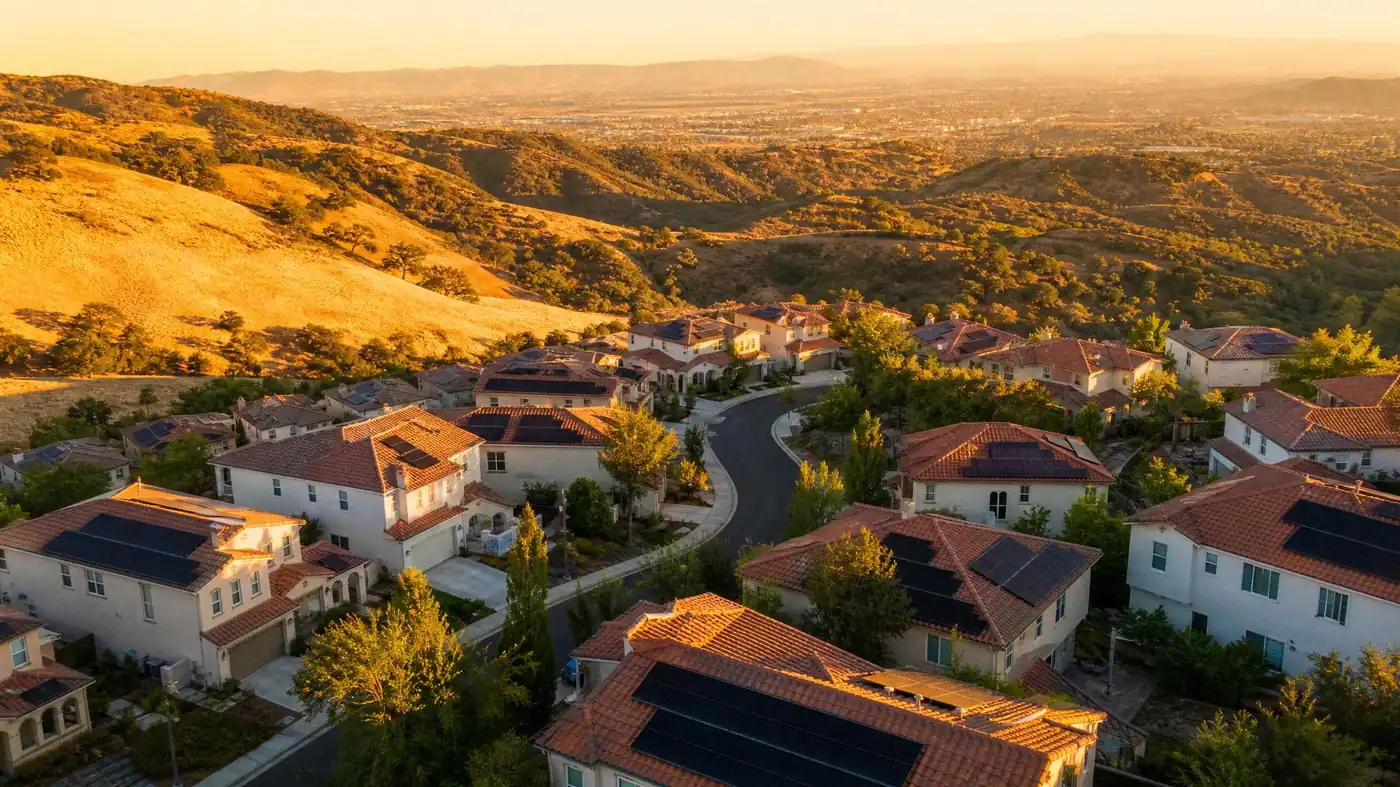 Adoption flagship
48% of homes
Santa Clarita
Nearly half of single-family homes here already run on rooftop solar. The valley heat did the convincing.
 Fastest growing
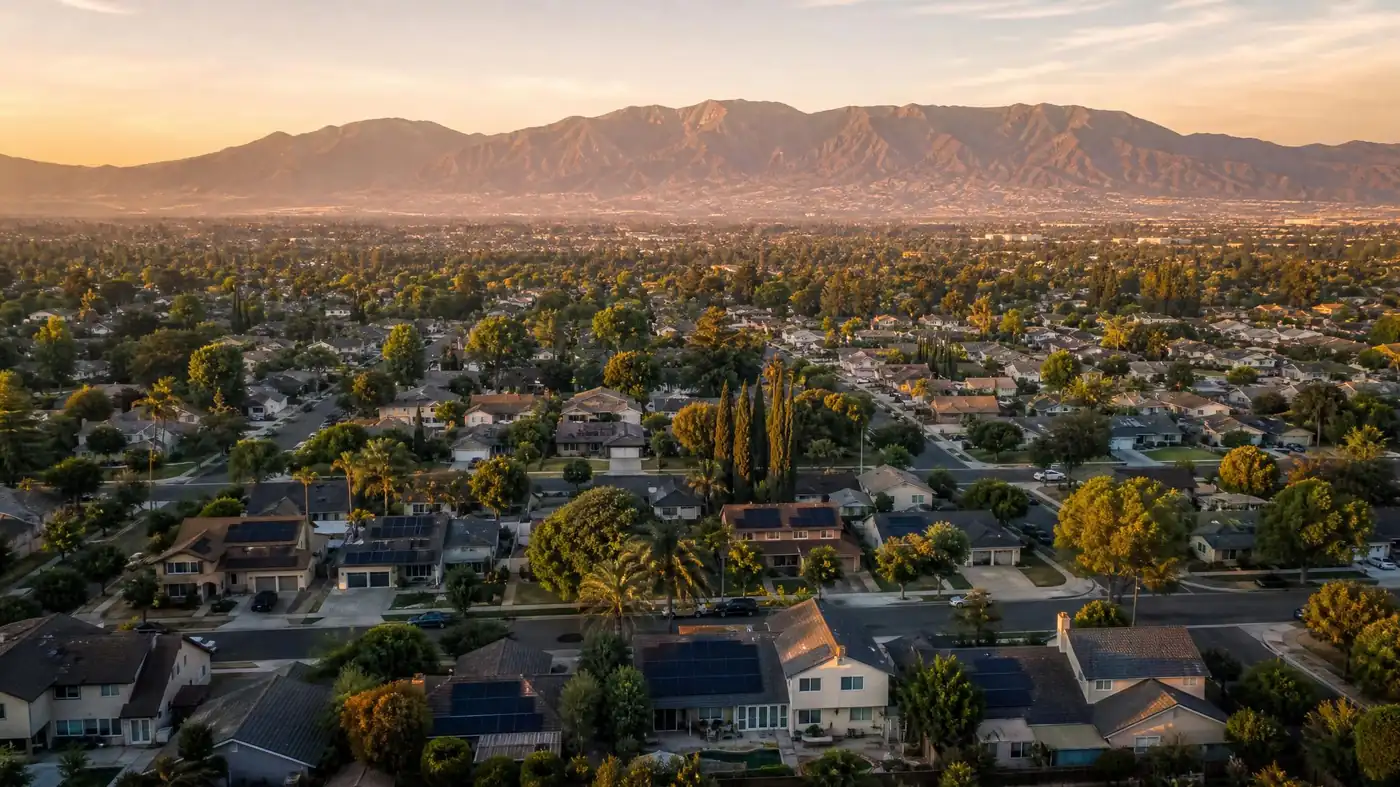
1,204
Ontario
Systems added last year alone, among the fastest anywhere in SoCal.
 Cheapest power
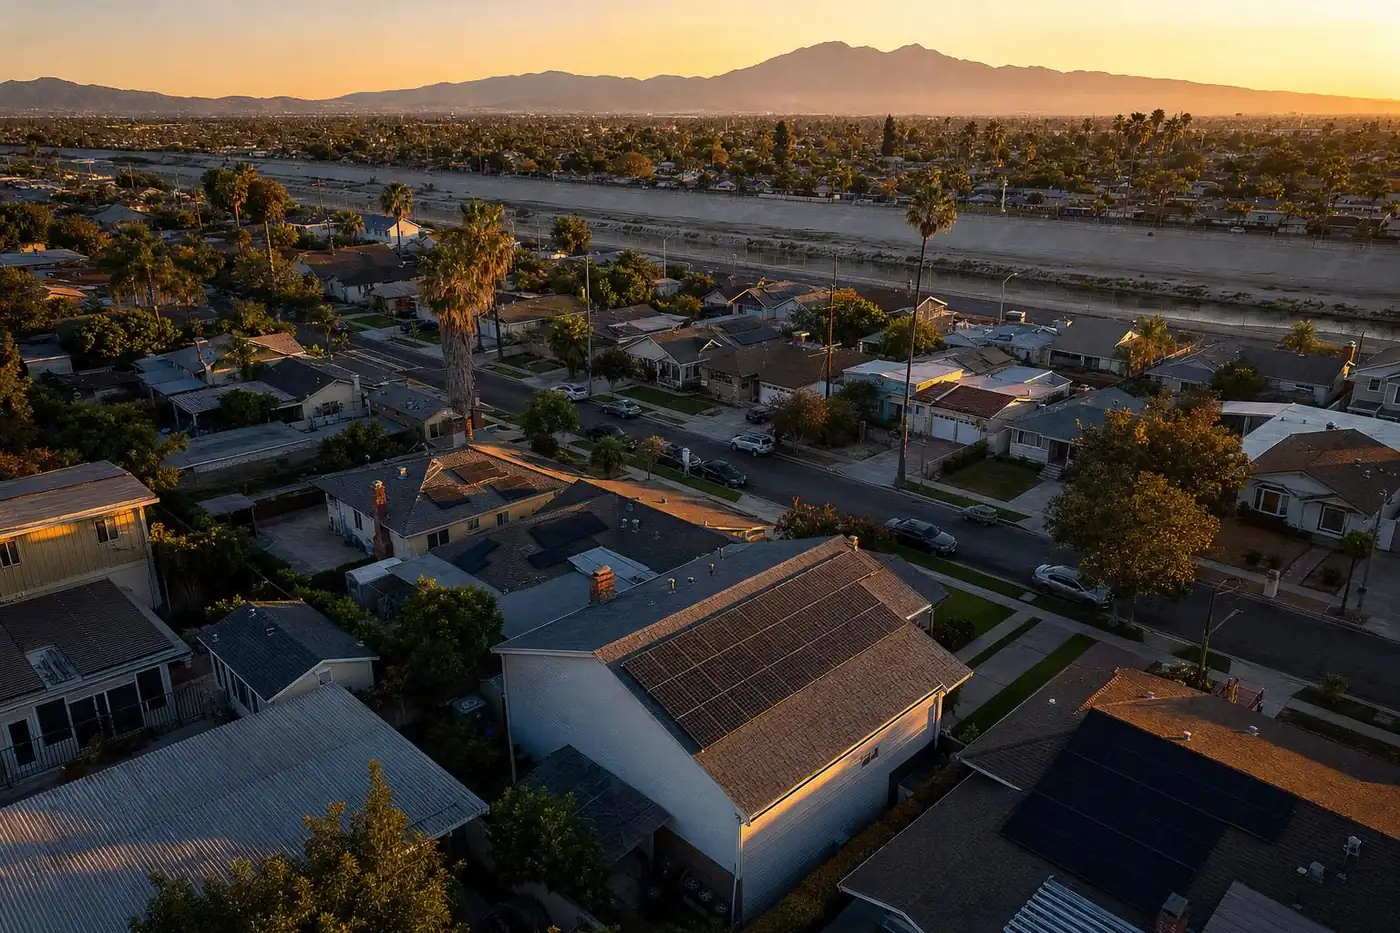
$0.17/kWh
Anaheim
SoCal's lowest rates. Here solar is how you lock the good deal in for decades.
 Two utilities, one city
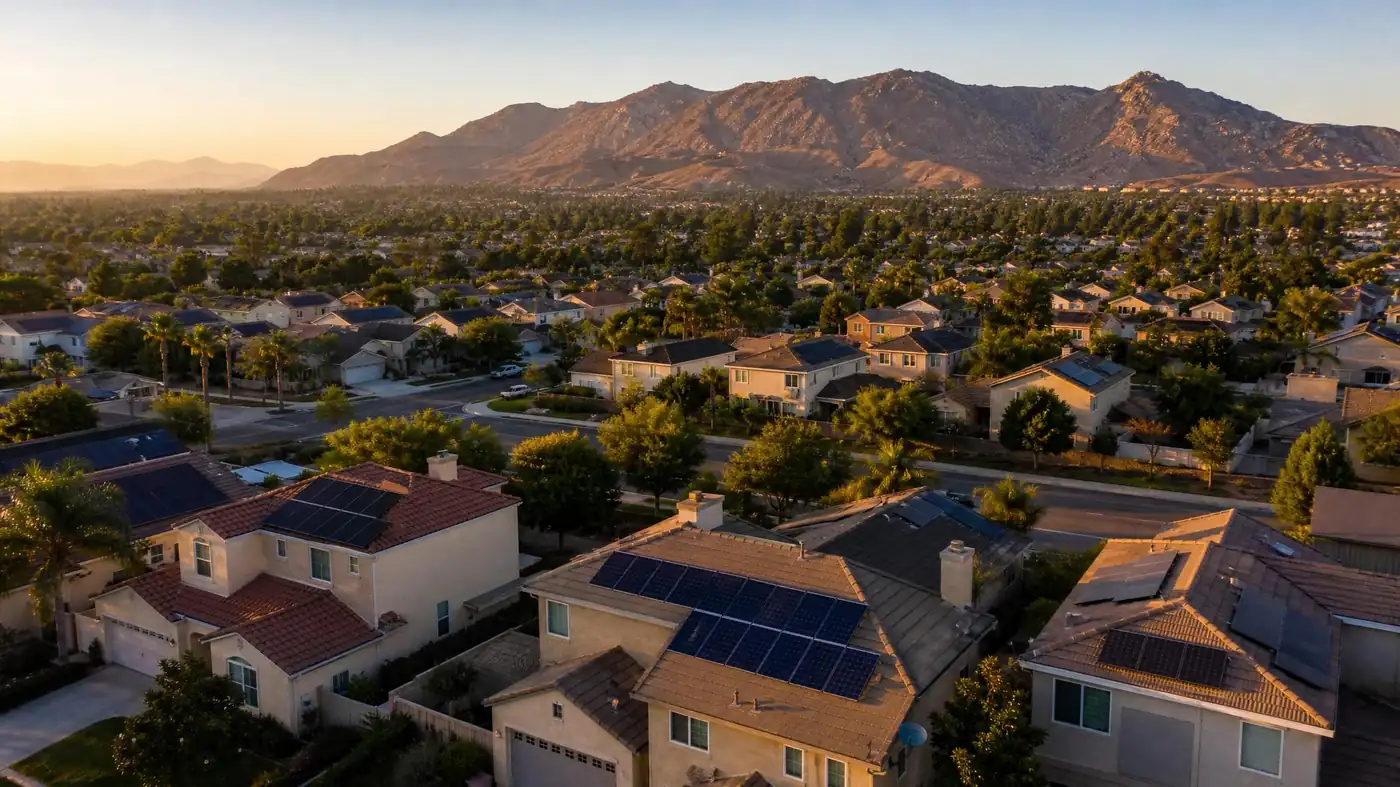
2 utilities
Moreno Valley
This city splits between SCE and its own municipal utility, and neither is cheap. Whichever one serves your address, solar beats the rate.
Every city guide
Grouped by county · more states on the wayCalifornia · 18 citiesTexas · coming soonArizona · coming soon
Los Angeles County
7 cities · 15 installers compete hereOrange County
4 cities · 19 installers compete hereRiverside County
3 cities · the lowest pricing in our lineup · 10 installers compete hereSan Bernardino County
2 cities · 11 installers compete hereSan Diego County
2 cities · 9 installers compete hereAdoption = owner-occupied single-family homes with rooftop solar, modeled from public utility interconnection records and Census home counts. Orange bars mark cities where about two in five homes or more have already switched. Corona's figure uses postal-city records that include some neighboring communities. All figures are modeled estimates; your price comes from your address.
Your city sets the rules. Your roof sets the price.
Run your address and get the exact number in about two minutes, no sales call required.