Page 16 | Solar.com

Please enter a valid zip code.

Can I Carry Forward Unused Solar Tax Credit with the One Big Beautiful Bill as Law?

By Federal Solar Tax Credit, Solar Rebates & Incentives No Comments

The solar.com editorial team monitors solar forums and communities to better inform what questions are being asked so we can create relevant content. (Huge shout out to the r/solar community on Reddit. If you’re thinking of going solar definitely check out r/solar – there’s a ton of great advice and helpful posters there). 

Here’s one subject that’s repeatedly being asked about, and that someone emailed us directly about: With the consumer solar tax credit, claimed under Section 25D, going away at the end of 2025, what happens to the Carry Forward Provision? If I don’t have sufficient tax liability to claim the full credit on my 2025 taxes, can I still rollover unused credit to 2026 and beyond? 

Jump ahead:

With the usual caveat of this not being tax advice and to consult your accountant about your specific situation, let’s dive into the topic. 


Understanding the Solar Tax Credit Carry Forward Provision

The carry forward provision for the 25D Residential Clean Energy Credit allows homeowners with insufficient tax liabilities to “carry forward” their tax credit to future tax years, where they may be able to use the leftover credit amount. As a non-refundable credit, the solar tax credit can only be used to reduce your tax liability, and the IRS does not send you a check back if your “credits” exceed your liabilities.

In some scenarios, homeowners have the financial means to go solar, but through tax efficiency, their tax credit exceeds their tax liability. With the carry forward provision, they’re able to spread out that tax credit over multiple years to monetize it. 

How does carrying forward the solar tax credit work?

As an example, meet Mr. and Mrs. Panel. The Panel family had a busy 2025. Mrs. Panel gave birth to Baby Panel in February and she made the decision to take a year off work to spend time at home. They also realized, thanks to Baby Panel, that they’d outgrown their life in the city and decided to buy a house. To finance this purchase, they sold some of their investments at a loss. Mr Panel kept working, making $100,000/year at his job as an importer/exporter at Vandelay Industries. 

With the ending of the tax credit, the Panels decided to go solar in 2025 (through solar.com which helped them vet local installers and created customized proposals for them). The Panels installed a 10kW system at $3/watt which generates a $9,000 tax credit, but their federal tax liability was only $1,000 after accounting for the child tax deduction, the tax loss harvesting, and the various deductions for purchasing their home. 

Thanks to the carry forward provision, the Panels can offset their remaining $1,000 tax liability for 2025 and next year, in 2026, when things “normalize” and Mrs Panel goes back to work, they can monetize the remaining $8,000 credit. 


But with the Tax Credit Expiring, Does the Carry Forward Remain?

The IRS generally considers the project qualified for the rules of the tax year in which it becomes eligible for the tax credit. Because the Panels had their project mechanically complete in 2025, this means the 2025 rules apply, and they can carry forward their unused tax credit—even with the “One Big Beautiful Bill” terminating this tax credit at the end of 2025.

In January 2025, the IRS released a Fact Sheet regarding home energy credits, including the Section 25D Clean Energy Property Credit (which we know as the solar tax credit). Page 15 of this Fact Sheet confirms that carrying forward unused tax credit is currently allowed:

Screenshot from IRS Fact Sheet released on January 2025.

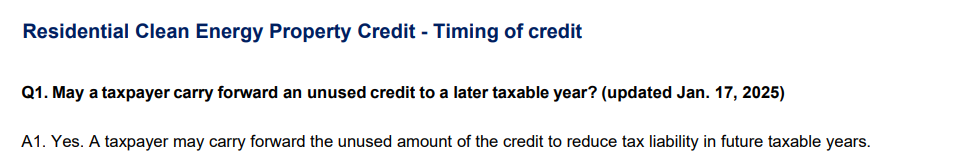
Notably, the IRS does not give an expiration date for carrying forward credit. But, again, there are nuances to these rules and the IRS may change its guidance later in 2025. For instance, the 25D tax credit is claimed on Form 5695, which typically includes lines specifically for carrying forward unused credit. However, with the 25D credit ending, this form may not be available in future tax years and it may require different forms and processes to claim unused credit.

As such, homeowners should always seek professional counsel based on their specific circumstances from a certified professional. 

We’d also like to point out that while there are absolutely scenarios where homeowners can have near term low tax liabilities (like our fictional friends the Panels) a better option for homeowners with persistently low tax liabilities would be to enter into a PPA or lease arrangement where a company monetizes the tax credit and offers a savings from the utility rate, while taking on the obligation of maintaining the system. 

Have a question for the solar.com editorial team that you’d like us to address? Email us at newsroom@solar.com

why electricity costs are rising

Why Electricity Costs Are Rising in 2025 and Where They Are Rising Fastest

By How Do Solar Panels Lower Your Electric Bill?, The Pros and Cons of Rooftop Solar in 2026 No Comments

What’s Causing Higher Electric Bills in 2025?

Electricity prices are rising faster than inflation due to a surge in demand from data centers, outdated energy infrastructure, and increased utility spending on grid upgrades and transmission. The average U.S. household saw its rate increase 6–7% in the past year, with further hikes expected in coming years. Fortunately, solar energy offers a way to lock in lower, predictable energy costs for the long term.

Jump to a section:


How Much Have Electricity Rates Risen?

The average residential electricity rate in the U.S. increased 6.7% from June 2024 to June 2025, outpacing inflation for core commodities such as food, shelter, and services during the same time period. For the average U.S. household, that translates to an additional $13.50 per monthly electricity bill, or $162 per year, for using the same amount of electricity.

And this isn’t a one-year blip. From 2021 to 2025, the average U.S. electricity rate increased 34%, adding over $500 to the average household’s annual electricity costs.

Month/Year Avg. Price (cents/kWh) % Change from previous year
June 2021 14.2 +3.6%
June 2022 16 +12.7%
June 2023 17 +6.3%
June 2024 17.8 +4.7%
June 2025 19 +6.7%

Of course, electricity rates rise at different speeds throughout the country, and some states have been hit harder than others in recent years.


Which States Are Hit Hardest by Rising Electricity Costs?

Residents of Maine, Washington D.C., Maryland, Connecticut, and California have seen their electricity costs rise the fastest in recent years, with rates rising 29-39% from 2021 to 2025—much faster than the historical average.

From 1980 to 2020, electricity rates increased at a relatively steady rate of 2-3% per year on average—on or around the standard rate of inflation. Over a four-year period, it would be natural to expect your electricity rate to rise 12%. However, in the last four years, electricity rates have increased by more than 12% in all but 9 states.


With electricity costs increasing in virtually every state, it’s natural to wonder if your electricity costs will keep rising, flatten out, or fall in the coming years. To answer that, we’ll need a closer look at why electricity rates are rising.


What’s Driving the Spike in Electricity Costs?

Electricity prices aren’t just rising randomly—they’re being pushed upward by a perfect storm of technological, structural, and economic factors. Here are the key drivers fueling the surge in utility rates across the U.S.:

AI & Data Center Demand Is Exploding

The rise of artificial intelligence, cloud computing, and digital services is triggering unprecedented electricity demand from data centers—placing strain on local grids and driving up wholesale power costs. Consumers are at risk of “subsidizing” the power needs of Big Tech, as infrastructure upgrades are spread across all customer bills.

There’s also rising demand for electricity to power air conditioning and electric vehicles. In July 2025, peak electricity demand reached two new all-time highs as more Americans cranked their air conditioners to stay cool in the summer heat.

Graph showing US electricity demand setting two new records in July 2025

Aging Infrastructure and Underinvestment

The U.S. electric grid is decades old and increasingly fragile—especially in an era of extreme weather events. Utility companies are spending billions to modernize transmission lines, replace aging transformers, and meet reliability mandates, and the cost of updating the grid is passed on to ratepayers through higher rates.

Supply Chain Delays, Tariffs, and Inflation in Grid Components

Post-pandemic disruptions, global inflation, and recently enacted tariffs are making it more expensive and slower to upgrade the grid. For instance, prices for power transformers are up 75% since 2019 and cable costs have nearly doubled, according to the IEA. Labor shortages are compounding delays, pushing utility projects over budget and on longer timelines—again, with costs passed to customers.


Can We Expect Electricity Rates to Keep Rising?

Unfortunately, all signs point to yes—electricity rates are likely to keep rising over the next several years. Multiple expert forecasts, policy shifts, and technology trends suggest that energy bills will continue to grow, unless action is taken to stabilize the grid.

Wind and solar are perhaps the best tools to balance supply and demand on the power grid, given how quick and cost-effective they are to deploy. However, the One Big Beautiful Bill Act (OBBBA) signed on July 4, 2025 is expected to drastically reduce clean energy deployment and further increase electricity costs.

In fact, a study by NERA suggests that residential electricity rates will be 6.7% higher on average in 2026 as a result of the OBBBA removing clean energy incentives, with over a dozen states poised for rates 10% higher than they would be with clean energy incentives in place.

State Forecasted 2026 Rate pre-OBBBA Forecasted 2026 Rate post-OBBBA % Change
U.S. Average 16.06 17.13 6.7%
Wyoming 11.54 13.99 21.30%
New Mexico 14.56 16.97 16.50%
Illinois 14.77 16.77 13.50%
Washington D.C. 16.5 19.35 17.30%
Washington State 10.41 11.92 14.60%
North Carolina 12.74 14.46 13.50%
Missouri 11.59 13.06 12.70%
Kansas 13.69 15.33 12.00%
South Carolina 13.24 14.69 10.90%
Tennessee 11.33 12.75 12.50%
Delaware 15.35 16.99 10.70%
Maryland 16.6 18.35 10.60%
Arizona 14.06 15.54 10.60%

And the impacts of the OBBBA don’t end in 2026. In 2029, the average residential electricity rate is expected to be 7.3% higher without clean energy incentives than it would be with the incentives in place.


How Solar Protects You from Rate Hikes

Solar is the ultimate hedge against rising electricity costs because it allows you to set a flat, predictable cost for the electricity you need—without sacrificing the modern comforts of heating, air conditioning, and home EV charging. Home solar systems are typically designed to offset 100% of your average electricity usage, allowing homeowners to essentially swap in their ever-rising electricity bill for a low, steady cost for solar. Instead of dreading utility rate hikes, solar owners benefit from them by avoiding paying more and more each year for electricity.

How much can you save with solar? That depends on some key factors:

  • Your utility rate and how much it will rise in the future
  • How much electricity you use (and how much you can offset with solar)
  • Availability of net metering, tax credits, and other incentives
  • How you pay for your system (cash, loan, or lease)
  • The irradiance of your roof (how much sun it gets)

While the savings potential for each home is unique, one thing remains constant: grid electricity prices have increased faster than average in the 2020’s and are expected to continue rising for the foreseeable future.


FAQs About Rising Electricity Rates

Why are electricity prices increasing?

Electricity prices are rising due to an imbalance in supply and demand on an aging and fragile U.S. power grid and new roadblocks to building clean energy generation. The grid needs more and more electricity for power-hungry data centers, electric vehicles, and home electrification, and the cost to deploy power generation and transmission is ultimately passed on to consumers.

How much more can I expect to pay next year?

On average, electricity prices are expected to be 6.7% higher in 2026 than they would have been before the One Big Beautiful Bill Act (OBBBA) removed incentives for clean energy generation.

Is solar worth it if my bill is already low?

Solar can provide long-term cost savings for households with low electricity bills, especially when the system benefits from net metering, tax credits, and other incentives. With a typical performance warranty of 25 years, solar provides a long-term hedge against rising utility rates.

Will electricity be cheaper in the future?

Grid electricity is not expected to get cheaper in the foreseeable future, especially as more power-hungry data centers come online and incentives for clean energy generation are removed by the One Big Beautiful Bill Act (OBBA). It is very expensive to build the power generation and transmission required to meet rising electricity demand, and those costs are typically passed on to utility customers through higher electricity rates.