Electrum’s New NEM 3.0 Savings Calculations Show Path to Maximum Bill Reduction in California

In a breakthrough for California’s residential solar market, Electrum is now offering the industry’s most accurate NEM 3.0 savings calculations and, in doing so, illuminating a path for homeowners to use solar and battery storage to achieve the minimum monthly bill payments enjoyed under NEM 2.0.
Before NEM 3.0 solar billing took effect in April 2023, a solar system designed to produce 100% of a homeowner’s average electricity consumption could also be expected to offset ~100% of the homeowner’s electricity bill (aside from certain non-bypassable charges). But given the extremely low export rates of NEM 3.0, a solar-only system designed to produce 100% of a homeowner’s electricity usage only provides roughly 55% bill offset. This potentially leaves homeowners with solar payments and leftover utility bill payments to make each month.
Electrum’s calculations for two new battery discharge modes show a path 70-90% bill offset and a payback period between 5-7 years for solar and battery systems purchased with cash.
Discover your path to maximum NEM 3.0 savings. Start here.
Battery discharge modes: The key to maximum savings
The defining feature of NEM 3.0 solar billing is that solar export rates are ~75% lower than they were under NEM 2.0. Instead of earning retail value for the excess electricity their solar systems push onto the grid, solar owners typically earn somewhere around 4-5 cents per kilowatt-hour.
So, instead of exporting solar electricity to the grid for little-to-no value, it’s much more valuable to store and use it onsite to avoid drawing electricity from the grid – especially during peak pricing.
But the question is: When are the best times to charge, store, and discharge batteries under NEM 3.0?
With 576 different export rates that change by the hour, day, month, and year, the calculations required to answer this question are mind-boggling. Electrum’s tech team dug in, crunched the numbers, and built the only platform where homeowners can get a clear and accurate picture of their potential savings with three different battery discharging modes and compare multiple binding quotes all in one place.
The old calculation: Time-of-Use (TOU) mode
Electrum’s first, and most conservative, iteration of battery calculations was based on charging the battery with excess solar production and discharging it only during peak time-of-use hours. The idea is to avoid pulling electricity from the grid when it’s most expensive (summer evenings).
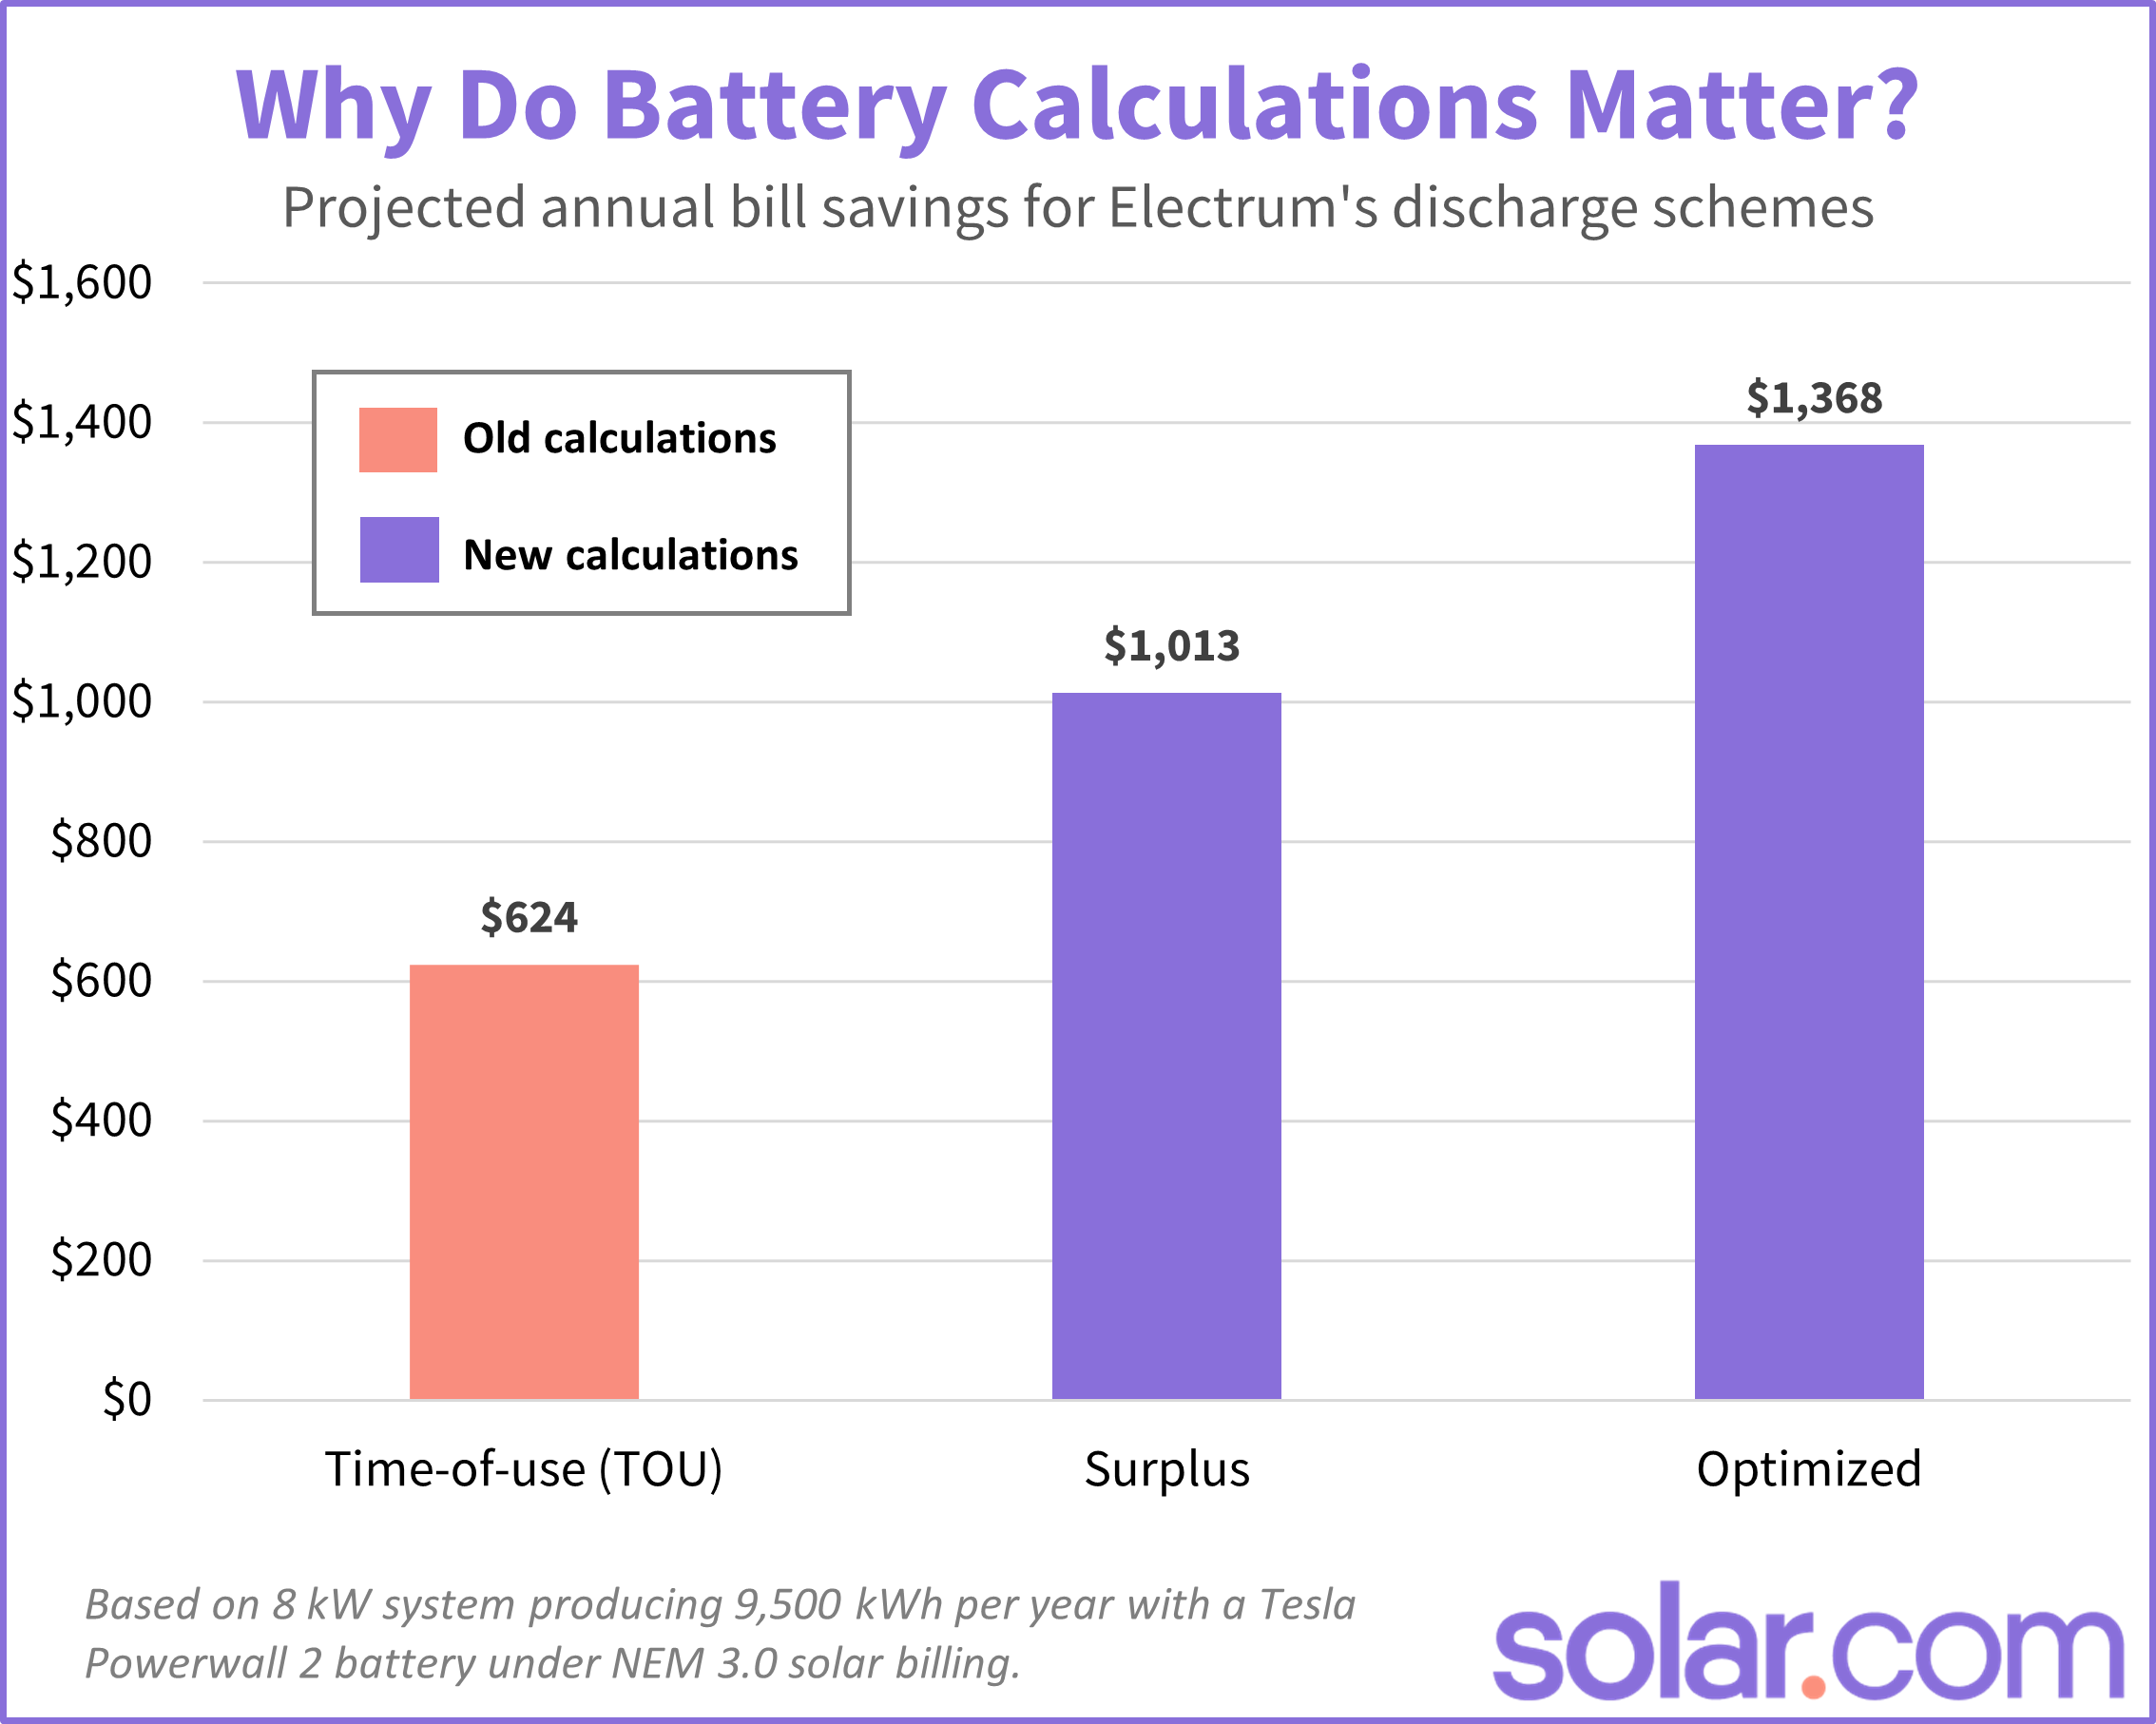
Under this discharge mode, a homeowner with an 8 kW system producing 9,500 kWh per year with a Tesla Powerwall 2 could expect to save $624 per year in avoided utility costs.
The new calculations: Surplus and Optimized modes
Electrum’s calculations for two new battery discharge schemes show substantially greater bill reductions and savings than the time-of-use mode.
In the Surplus scheme, the battery is charged with excess solar production and discharged anytime household electricity usage is greater than the solar production. The big difference is that the TOU scheme is limited to discharge only during TOU hours. In Surplus mode, the battery can discharge at any time and further reduce importing and exporting from the grid.
Under the Surplus scheme, a homeowner with an 8 kW system producing 9,500 kWh per year with a Tesla Powerwall 2 could expect to save $1,103 per year in avoided utility costs – $32 per month more than the TOU scheme.
In the Optimized scheme, the battery is charged with excess solar production, but the battery uses a predictive model to discharge at the optimal times to prioritize savings. In other words, the battery learns the homeowner’s consumption habits and optimizes its charging/discharging schedule accordingly.
Using this mode, homeowners can take advantage of peak export windows in September, when utilities will pay several dollars per kWh of electricity exported onto the grid.
Under the Optimized scheme, a homeowner with an 8 kW system producing 9,500 kWh per year with a Tesla Powerwall 2 could expect to save $1,368 per year in avoided utility costs. That’s $62 more per month than the TOU scheme!
Optimized mode presents a real opportunity for homeowners to achieve 100% electricity bill offset and sets them up for Virtual Power Plant (VPP) programs forming in California.
Why are the new calculations a big deal?
For homeowners, Electrum’s new battery discharge calculations revive the once-lost hope of achieving:
- 5-7 year payback periods that have come to be expected of California solar systems
- Solar and battery payments lower than their average electricity bill (aka Day 1 savings)
The new calculations also present a promising new chapter after a rocky start to NEM 3.0.
Since it passed in April 2023, NEM 3.0 and its 576 export rates have posed a real challenge to the solar industry. Frankly, rooftop solar companies have struggled to accurately calculate and communicate savings potential to their customers.
While some companies offered overly conservative savings estimates that failed to attract customers, others knowingly over-promised savings and ignored the very real prospect of “leftover bills” to sell systems that are doomed to fall short of expectations. A third group shied away from the challenge altogether and reverted to selling leases and power purchase plans (PPAs) that are less beneficial to homeowners.
In addition to being exposed to desperate sales tactics, Californians are getting solar quotes that are all over the map and finding it difficult – and frustrating – to navigate the solar process.
Thanks to relentless work from Electrum’s technology team, homeowners now have a North Star to follow when navigating the California solar industry, and a platform to get accurate NEM 3.0 savings estimates based on binding quotes from trusted installers.
Explore your solar and battery savings potential here.
Your next step
See exactly what solar costs on your roof
We use satellite data and your utility rates to show a real price and payback — in about 90 seconds, with no sales calls.