For years, solar energy in the U.S. was a “homeowners-only” club. If you didn’t own a roof or have express permission from a landlord, you were locked out.
But things are changing in 2026. Thanks to new safety standards (UL 3700) and a wave of state-level legislation sweeping the country, more and more apartment dwellers and renters are finally gaining access to the benefits of solar power. This guide breaks down how balcony solar works, why it’s growing in popularity, and how to tell if it’s right for your home.
Jump ahead:
What is Balcony Solar?
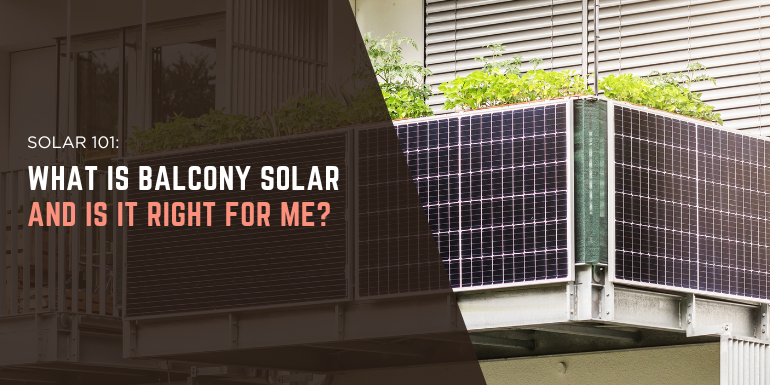
Balcony solar (also known as “plug-in solar”) consists of 1–3 portable, lightweight panels that attach to a balcony railing, patio, or fence. Unlike traditional solar, these systems:
-
Plug into a standard 120V wall outlet using a specialized microinverter.
-
Require zero permanent construction or “no-drill” mounting.
-
Are completely portable, meaning you can take your “power plant” with you when you move.
Treating solar like a toaster oven: New 2026 legislation in several states seeks to reclassify these small systems (typically under 1.2 kilowatts) as household appliances rather than electrical power plants. If you can safely plug in a toaster, you should be able to safely plug in a balcony solar kit.
2026 Legislative Updates: The State of Play
The biggest barrier to plug-in solar has always been “interconnection”—the red tape from utilities that prevents you from feeding power back into your home’s outlets. In 2026, the legal landscape is showing signs of a dramatic shift.
Utah emerged as a leader in balcony solar in 2025 by passing “Plug-and-Play” legislation and carving out an exemption for systems up to 1.2 kW in size. Residents can now plug in certified kits without seeking utility approval or paying interconnection fees. Maine’s balcony solar bill was signed into law in April and takes effect in July 2026. Virginia and Colorado are close behind, with similar bills expected to become law.
As of April 2026, nearly 30 states are considering or have introduced bills to legalize plug-in solar. Some of the more notable instances are listed below.
| State |
Balcony/Plug-in Solar Legislation |
| Alaska |
HB 257 introduced in January 2026 |
| Arizona |
HB 2843 introduced in January 2026 |
| California |
SB 868 introduced in January 2026 |
| Colorado |
HB 26-1007 introduced in January 2026
|
| Connecticut |
HB 5340 introduced in March 2026 |
| Delaware |
SB 270 introduced in March 2026 |
| Hawaii |
HB 2435 introduced in January 2026 |
| Idaho |
H0612 introduced in February 2026 |
| Iowa |
HF 2046 introduced in January 2026 |
| Illinois |
HB 4371 introduced in January 2026 |
| Indiana |
HB 1084 introduced in January 2026 |
| Maine |
LD 1730 signed into law in April 2026, takes effect in July 2026
|
| Maryland |
HB 0345 introduced in January 2026 |
| Massachusetts |
H.4744 introduced in November 2025
|
| Michigan |
HB 5764 introduced in March 2026
|
| Minnesota |
HF3555 introduced in February 2026
|
| Missouri |
HB 2528 & HB 2444 introduced in January 2026
|
| New Hampshire |
SB 540 introduced in November 2025
|
| New Jersey |
S 2369 introduced in December 2025
|
| New Mexico |
SB 157 introduced in January 2026
|
| New York |
Solar Up Now New York (SUNNY) Act introduced in September 2025
|
| Oklahoma |
HB 4060 introduced in February 2026 |
| Oregon |
HB 4080 introduced in February 2026
|
| Pennsylvania |
HB 1971 introduced in October 2025
|
| Rhode Island |
S 2359 introduced in January 2026 |
| South Carolina |
HB 4579 introduced in January 2026 |
| Vermont |
S.202 introduced in January 2026 |
| Virginia |
SB250 expected to become law in July 2026, take effect in January 2027 |
| Washington |
SB 6050 introduced in January 2026 |
Is Balcony Solar Safe? The UL 3700 Standard
The most common question from landlords and utilities is: “Is it safe to plug a power source into my wall?”
In early 2026, UL Solutions launched the UL 3700 certification. This is the “Gold Standard” for plug-in solar safety. If a kit is UL 3700 certified, it includes:
-
Automatic Power Cut-Off: The system is “smart.” If you unplug the cord from the wall while the sun is shining, the metal prongs on the plug become “dead” in less than a second. This prevents anyone from getting a shock from the exposed plug.
-
Grid Outage Protection: If the power goes out in your neighborhood (a blackout), the panels automatically stop sending power to your home or the grid. This ensures utility workers fixing the lines aren’t accidentally shocked by your panels.
-
Overload Protection: The certification ensures the kit won’t “backfeed” too much power and overheat your home’s existing wires. It monitors the electricity flow to make sure your circuits stay cool and safe.
-
Weatherproof & Durable: The panels and the plug-in box must be able to withstand extreme heat, freezing rain, and high winds without leaking electricity or breaking down.
-
Ground-Fault Protection: Every kit must have built-in safety sensors (like the “Reset” buttons on your bathroom outlet) that instantly shut the system down if it detects any leak of electricity.
How Much Can You Actually Save?
Balcony solar isn’t meant to take your home “off-grid.” It simply reduces the amount of electricity you need to buy from your utility.
Every home has a baseline of energy used by “always-on” appliances, like your refrigerator, Wi-Fi router, and standby electronics. A standard 800 Watt balcony kit can often cover 15% to 25% of a typical apartment’s monthly electricity needs.
|
|
| Average Cost for Balcony Solar |
$600 – $1,500 |
| Estimated Payback |
3–6 years (depending on local utility rates) |
| Expected Solar Output |
1,000 – 1,400 kWh per year in sunny areas |
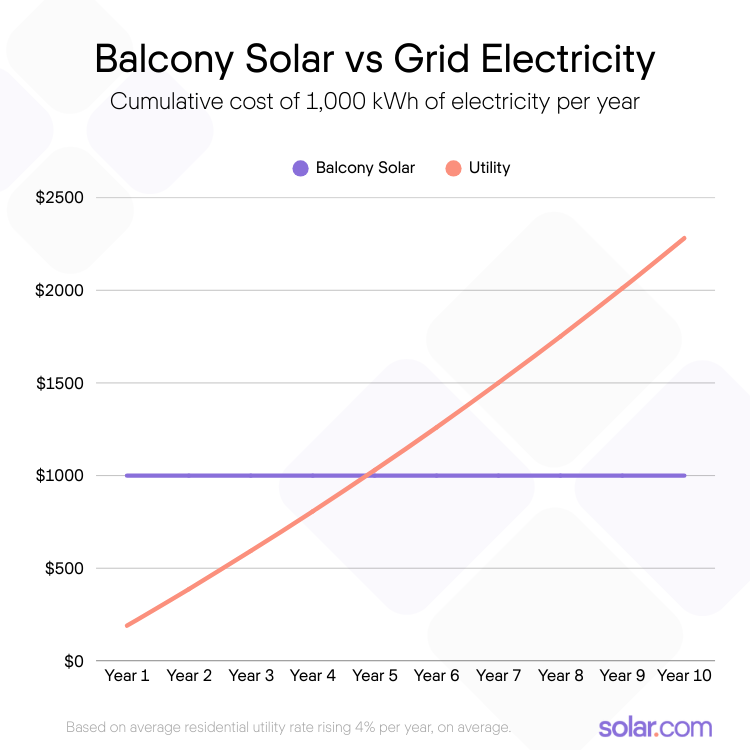
For instance, let’s say you buy a plug-in solar array for $1,000 and it produces 1,000 kWh per year, on average. Over 10 years, you’ve paid $1,000 for electricity that would have cost over $2,800 if you bought it from your utility—a savings of $1,800.
Is Balcony Solar Right for You?
Renters with high utility bills and south-facing surfaces to place the panels typically see small, but meaningful utility bill savings with balcony solar. Depending on state regulations, homeowners can enjoy the same, but can typically get more substantial savings from a professionally installed solar system that offsets most or all of their utility bill.