Page 48 | Solar.com

Please enter a valid zip code.

NEM 3.0 export rate adders

NEM 3.0 Export Rate Adders: Why It Pays to Go Solar Early in NEM 3.0

By How Much Do Solar Panels Save?, Solar Panel Cost No Comments

The new solar billing structure for California’s three investor-owned utilities has caused many homeowners to pause, alter, or altogether abandon their plans for installing rooftop solar. But while home solar in California isn’t the complete no-brainer it once was under 1-to-1 net metering, it still offers some of the best energy cost savings potential of any state in the US.

This is especially true for the earliest adopters of NEM 3.0 solar systems, who can benefit from three things:

  1. Export rate adders up to 4 cents per kilowatt-hour
  2. Several months of billing under the NEM 2.0 structure
  3. Avoiding imminent utility rate hikes

Don’t get me wrong: We all miss NEM 2.0. But it’s officially gone, and the early birds in NEM 3.0 will get the fattest worms.

In this article, we’ll break down the three economic advantages of going solar as soon as possible under NEM 3.0

NEM 3.0 residential export rate adders

The first, and greatest, advantage of going solar under NEM 3.0 in 2023 is locking in the highest possible export rate adders.

“Export rates” refers to the value of excess production that solar owners push onto the grid, and “adders” means exactly what it sounds like.

If you’re familiar with NEM 3.0, you know that its defining feature is export rates that are, on average, ~75% lower than they were under NEM 2.0. That’s because the NEM 3.0 export rates are based on the “Avoided Cost Calculator” instead of the retail price of electricity and vary throughout each hour of the day.

Export rate adders are designed to ease the shock of these dramatically reduced export rates and reward early adopters of NEM 3.0 solar billing. As the chart below shows, export adders are only available for the first five years of NEM 3.0 and decrease by 20% each year, so the earliest NEM 3.0 adopters lock in the highest export rate adders.

Interconnection year PG&E adders (cents/kWh) SCE adders (cents/kWh)
Year 1 (April 15, 2023 – April 14, 2024) 2.2 4
Year 2 1.8 3.2
Year 3 1.3 2.4
Year 4 0.9 1.6
Year 5 0.4 0.8

Export rate adders are not available to SDG&E customers.

For example, an SCE customer that gets permission to operate (PTO) in the first year of NEM 3.0 locks in a 4 cents/kWh export rate adder for every single hour of the first 9 years of operation.

Four cents per kilowatt hour may not sound like much but in many cases, this 4-cent/kWh adder would double the hourly export rates for SCE in 2023, as shown in the example day below.

example NEM 3.0 export rates with 4 cent/kwh export rate adder

Export rate figures for example purposes only.

And remember, this 4-cent adder is locked in for 9 years and continues to increase the value of your excess solar product, even as NEM 3.0 export rates rise over time. The chart below shows the average NEM 3.0 export rates expected from 2023-2050, based on an analysis by CALSSA.

The lowest rates are between 2023 and 2030, but homeowners can improve these rates by interconnecting a system in the first year of NEM 3.0.

average NEM 3.0 export rates 2023-2050, no adders

Quick facts about NEM 3.0 export adders

  • Export adders increase the c/kWh value of excess electricity pushed onto the grid from NEM 3.0 solar systems
  • Adders increase the value of exports for every single hour for the first 9 years of operation
  • SCE and PG&E customers who interconnect a solar system in the first year of NEM 3.0 (before April 14, 2024) lock in the highest export adder
  • Export rate adders are only available for the first 5 years of NEM 3.0 and decrease by 20% each year
  • Adder value is based on the interconnection date of the system


NEM 2.0 billing during the NEM 3.0 transition

In addition to locking in the highest export rate adders, the earliest NEM 3.0 adopters will likely benefit from several months of NEM 2.0 billing that can increase their savings and decrease their payback periods.

NEM 3.0 is an incredibly complicated billing structure that features 576 different export rates throughout the year. And now that it’s approved, the IOUs have the task of building, testing, and launching brand-new software to accommodate solar billing.

SCE and SDG&E’s NEM 3.0 billing systems were implemented on December 15, 2023, according to CALSSA. However, PG&E has requested an extension to implement their NEM 3.0 billing system until August 31, 2024. That means PG&E customers can go solar under NEM 3.0 and still enjoy several months of NEM 2.0 billing before the system is implemented.

Sam breaks this strategy down in the video below.

Related reading: Electrum’s New NEM 3.0 Savings Calculations Show Path to Maximum Bill Reduction in California

Avoiding utility rate hikes

The final advantage of being an early NEM 3.0 adopter is hedging against the IOU rakes hikes coming in the next few years.

According to forecasts in the 2023 Senate Bill 695 Report, IOU customers can expect rate hikes averaging 65 to 10.4% per year from 2023 to 2026, as shown in the table below.

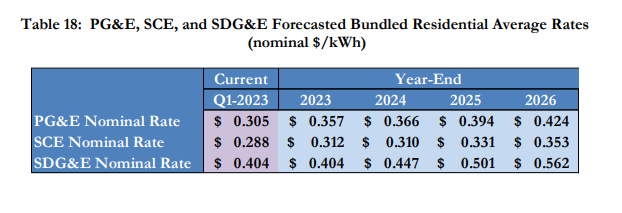
If rates increase as forecasted, the average monthly residential electricity bill would increase to:

  • $255 in PG&E territory
  • $192 in SCE territory
  • $250 in SDG&E territory

Meanwhile, a financial analysis of binding quotes on solar.com shows that IOU customers can achieve 70-90% bill offset and a 5-7 year payback period with NEM 3.0 solar and battery systems purchased with cash.

The bottom line

There’s no denying that NEM 3.0 solar billing isn’t nearly as favorable to homeowners as NEM 2.0. However, even under NEM 3.0, home solar is far more affordable than purchasing electricity from a utility provider. And thanks to adders and a small window to get NEM 2.0 billing, the early adopters of NEM 3.0 can maximize those savings and make the best of the situation.

If you’d like to see your potential solar savings, connect with an Energy Advisor to design custom solutions and generate binding quotes from vetted local installers.

Start your solar project today.


whats agood price for rooftop solar

What’s a Good Price for Rooftop Solar in 2024?

By Solar Panel Cost, Solar Panel Cost Per Watt No Comments

At its core, rooftop solar is a way to pre-purchase 25 years of electricity in order to hedge against ever-rising utility rates – quite similar to buying bulk coffee grounds instead of individual Venti Lattes from Starbucks.

The return on this long-term investment depends on a handful of key factors, including the price of the solar system itself. After all, the cost of your solar system is your line in the sand that says “This is how much I’m paying for electricity.”

Like anything else, homeowners want to know they’re paying a good price for solar and, by extension, electricity. So, in this article, we’ll take a look at average solar prices, how much they can vary, and what makes a good price for rooftop solar.

Jump to a section:

Let’s start with a recap of where residential solar prices have been in the last five years and where they are now.

What’s the average price of rooftop solar?

After decades of falling dramatically, the cost of residential solar projects – measured in Price Per Watt (PPW) – bottomed out at $2.92 per watt in 2019 and has increased slightly in the three years since to reach $3.27 in the first half of 2023, according to data from the Solar Energy Industries Association (SEIA).

Graph of residential solar PPW from 2011 to 2023

PPW measures the total cost of the project per watt of solar capacity installed. For context, residential solar panels are typically rated between 350 and 400 watts each, and the average rooftop solar system is around 7,000 watts (7 kilowatts).

The price per watt of a solar project includes both “hard costs” like panels, inverters, and racking and “soft costs” like labor, permitting, interconnection, customer acquisition, and general overhead. However, PPW does not typically include interest costs from taking out a solar loan.

Given the average solar system is around 7 kW (7,000 watts), the table below shows the average price of a home solar system during the last 15 years.

Residential solar price per watt (PPW) 2011-2023

Year PPW System Size (W) System Cost
2011 $6.25 7,000 $43,750.00
2015 $3.65 7,000 $25,550.00
2019 $2.92 7,000 $20,440.00
2023 $3.27 7,000 $22,890.00

Now that we have a sense of the average, let’s get familiar with the range of prices you might see for rooftop solar in 2023 and 2024.

Comparing rooftop solar prices by company

Just like every other good and service – food, clothes, and electricity itself – the price of rooftop solar varies based on who you purchase the system from.

For example, let’s look at pricing for three of the industry’s most prominent publicly-owned companies: Sunrun, Sunnova, and SunPower. We analyzed public filings by these three companies to get a sense of the average price per watt for their residential projects over time.

Company Public filing Price per watt Methodology
Sunrun Q3 2023 $4.69 Latest quarter’s average creation cost + platform services margin
Sunnova Q3 2023 $4.18 Latest quarter’s total creation cost divided by watts of solar capacity deployed
SunPower Q2 2023 $3.69 Latest quarter’s revenue per watt + margin per watt for residential projects

Of course, prices are constantly fluctuating. The chart below shows PPW over time based on our analysis of public filings.

Graph showing PPW of public residential solar companies from 2017-2023

There are a few things to take away from this chart:

  1. Solar pricing is not uniform, even among companies of comparable size and structure
  2. Residential solar prices have been trending upward since 2019, as confirmed by the SEIA chart above
  3. Large public solar companies are reporting higher PPW than the SEIA’s average for the first half of 2023

On the other end of the spectrum, we’ve got Tesla – a privately owned and (once) nationwide residential solar services company – with an average PPW of around $2.50 (based on quotes we’ve been able to gather and analyze).

That gives us a range of more than $2 per watt for residential solar pricing – a difference of at least $14,000 on a 7 kW project. How in the world could prices vary so much for the same – or very similar – product?


Why does rooftop solar pricing vary so much by company?

To understand the variation in solar prices between companies, it’s important to first have a sense of what goes into the cost of a solar project.

As we mentioned above, rooftop solar costs can be broken into two categories: Hard costs and soft costs. Each category accounts for roughly half of the total project cost, based on the latest data from the National Renewable Energy Lab (NREL).

Pie chart showing hard versus soft costs of a residential solar project

While hard costs make up a substantial chunk of a solar project, they are relatively stable from company to company and can be controlled – to some extent – by selecting various models of panels and inverters.

Soft costs, on the other hand, can vary substantially from company to company and aren’t easily influenced by customers.

For example, you can easily select lower-priced panels and inverters to reduce the hard costs of your project, but you won’t have much luck asking a company to use lower-priced installation technicians to reduce the soft costs of your project.

Variations in soft costs

Drilling down a bit further, a substantial chunk of soft costs is dedicated to customer acquisition (aka marketing), profit, and general overhead – which can vary greatly from company to company.

For example, Sunrun is a large publicly traded company that:

  • Engages in complex and wide-reaching marketing campaigns
  • Has over 10,000 employees
  • Has obligations to public shareholders

These massive operating costs along with the public shareholder pressure certainly influence Sunrun’s soft costs and may help to explain the higher-than-average PPW reported in their public filings.

By contrast, residential solar companies that boast an exceptionally low PPW do so largely by reducing soft costs, often by replacing human sales and support staff with automation. This model can be effective for reducing upfront costs but comes at the expense of:

  • Robust guidance and customization during the design and sales processes
  • Human support and advocacy during permitting, installation, and activation
  • In-house (and easily accountable) installation services
  • Ongoing system monitoring, warranty support, and prompt maintenance

For example, we mentioned above that Tesla solar systems typically cost around $2.50 per watt. While this is exceptionally low, it’s well-documented that Tesla’s sales and customer service are largely automated and notoriously unhelpful – which can substantially affect your solar savings over time.

When it comes to your solar system, electricity production equals money. Every minute that your system is under-producing – or not producing at all – is a minute that you are paying too much for electricity and eroding your return on investment.

So, what is a good price per watt for rooftop solar?

A good price per watt for rooftop solar provides a balance of savings potential and robust warranty and service coverage. Based on recent solar pricing trends from the SEIA, this balance can be found in the $3-4 per watt range for residential solar projects.

If you focus only on finding the absolute lowest price, you risk sacrificing quality in workmanship and customer service which can actually eat away at your long-term savings. On the other hand, paying a higher PPW to work with a large public company doesn’t necessarily translate into higher quality and service. In fact, the added cost is likely going to pay for layers of corporate bureaucracy, expensive marketing campaigns, and insatiable shareholder demands.

The best way to find the Goldilocks Zone of solar pricing is to compare multiple quotes from local and regional solar installers. Connect with an Energy Advisor today to easily compare quotes from vetted installers in your area.